


Accuracy is the most quoted and least comparable specification in optical sorting. Every supplier claims high numbers; few state the conditions. Two machines both claiming 99% can perform very differently on your material, and the number you actually need is often not accuracy at all.
This article explains how sorting accuracy is genuinely defined, which measure actually predicts your economics, and how to test a machine properly before you commit capital.
The honest definition
Our own stated figure is deliberately specific, and the specificity is the point:
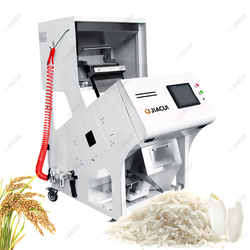
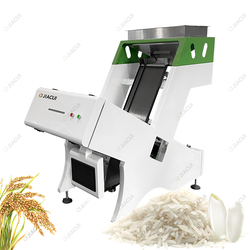
Sorting accuracy ≥99%, measured at a defined baseline: polished japonica-type rice with approximately 2% foreign content.
Three things follow, and they matter more than the number itself.
First, conditions are part of the specification. Cleaner input produces better apparent results; dirtier input produces worse. A supplier quoting a percentage without stating test material, contamination level and throughput has not given you anything you can compare. Ask always: *measured on what, at what contamination, at what feed rate?*
Second, rice is the reference standard for good reason — it is a well-defined, repeatable industrial test material. If your product is not rice, expect different behaviour and test with your own material.
Third, accuracy is a single dimension of a two-dimensional reality. This is where most buyers go wrong.
The two errors that actually matter
Sorting makes two possible mistakes, and they are economically asymmetric:
| Reality: good product | Reality: defective product | |
|---|---|---|
| Machine says accept | ✅ Correct | ❌ Missed defect (escaped defect) |
| Machine says reject | ❌ False reject (good product lost) | ✅ Correct |
- Missed defects cost you grade, customer complaints, possibly contracts.
- False rejects cost you directly in lost saleable product, every hour you run.
A machine optimised entirely for the first grows the second. Push sensitivity until nothing escapes, and you will also blow away acceptable product. Reduce sensitivity to protect yield, and defects pass through.
Overall accuracy blends these together, which is exactly why it can be misleading. A machine reporting 99% accuracy might be achieving that with excellent defect removal and painful yield loss — or the reverse. The blended number does not tell you which.
The number you actually need: carry-over ratio
For most processors the measure that predicts economics is the carry-over ratio — the proportion of acceptable product wrongly rejected. Sometimes expressed as "false reject rate" or inversely as "good product in reject."
``` Carry-over ratio = acceptable product in reject bin ÷ total reject bin output ```
Why this is the key figure:
- It is directly monetary. Every unit in the reject bin is revenue destroyed, valued at your selling price.
- It is measurable on your floor in a few minutes with a scale — no laboratory required.
- It responds to configuration. Sensitivity, feed rate, presentation and cleaning all affect it, meaning you can tune it.
- It reveals hidden costs. The inverse — defects reaching accept — is equally important, and the two together fully characterise performance.
A practical target depends entirely on product value. Losing one percent of premium cashew kernels is far more expensive than losing one percent of standard pulses. There is no universal correct figure — there is only a correct figure for your product and your prices.
The complementary figure is how similar measurement is applied across quality control generally, discussed in our over-rejection troubleshooting guide.
How to measure on your own line
Do this monthly, and definitely before and after any configuration change.
- Take a representative sample of input material, ideally 10–20 kg from normal production.
- Run it through the machine at normal production settings and feed rate. Do not slow it down for the test.
- Collect both accept and reject streams separately. Weigh each.
- Manually analyse the reject stream. Separate genuine defects from acceptable product. Weigh both fractions.
- Manually analyse a sample of the accept stream for escaped defects, using your standard inspection method.
- Calculate:
- `Carry-over = acceptable in reject ÷ total reject`
- `Escape rate = defects in accept ÷ total accept`
This yields the complete picture. Note steps 2 and 5 specifically: testing at reduced feed rate flatters the machine and tells you nothing about production reality, while skipping step 5 means you are optimising half the problem.
Repeat monthly and keep records. Gradual drift reveals developing faults — optical fouling, illumination decline, air quality loss — long before output complaints appear.
What actually determines achievable accuracy
Five factors, roughly in order of practical importance:
- Contrast between defect and acceptable product. Physics, not engineering. Black beans in green coffee sort superbly. Chalky kernels in white rice are intrinsically harder. No machine defeats poor contrast entirely — which is why you must set expectations by material, as covered in our material guides for cashew and rice.
- Stability of presentation. Particles must arrive singly, in a consistent layer. Overlapping units are read as averaged surfaces, defeating even excellent algorithms. This is usually the cheapest factor to improve.
- Illumination quality and consistency. LEDs decline gradually; drifting illumination shifts the color baseline and quietly degrades every decision. Cleaning and calibration are the first checks when performance drops.
- Algorithm type. Threshold comparison suits high-contrast cases. Trained recognition models handle low-contrast, high natural-variation materials far better — see AI deep learning for sorting for the mechanics.
- Feed rate relative to rating. Machines run near maximum cannot present particles properly. Sizing at 60–75% of rated capacity for routine production materially improves achievable accuracy. Details in our ROI and capacity planning guide.
Note how much of this list is configuration and maintenance rather than hardware. The single most effective accuracy improvement available to many processors is free: clean the optics and slow the feed slightly.
Comparing machines honestly
When evaluating quotations, insist on:
- The test condition — material, contamination level, throughput.
- Both error directions, not just blended accuracy.
- A test on your own material before purchase.
- Identical conditions across all competing machines.
- The re-sort / reject recovery arrangement, since well-designed lines recover much of the carry-over rather than accepting it as loss.
Any supplier unwilling to run your material is asking you to accept datasheet claims in place of evidence. Sample testing is standard practice and settles more in a morning than months of specification review.
The relationship with yield
This is the point most often missed in procurement: accuracy and yield are the same measurement viewed from different sides. Maximise one and you damage the other. The correct target is not maximum accuracy — it is the point where the combined cost of escaped defects and lost product is lowest.
``` Total cost = (escaped defects × penalty per unit) + (false rejects × selling price per unit) ```
For high-value products — cashew kernels, premium roasted coffee, tree nuts — the second term dominates, and you should tune conservatively toward yield, accepting slightly more escaped defects.
For thin-margin high-volume products — pulses, standard rice — they balance more evenly, and optimum settings sit closer to neutral.
There is no universally correct setting. There is only the correct setting given your product value, defect penalty and buyer tolerance. This is exactly why so much of our material-specific guidance emphasizes economics alongside technique.
FAQ
My supplier claims 99.9% while another says 99% — should I pay more?
Not on the number alone. Ask for the test condition. The higher figure may be measured on cleaner input or lower throughput. Compare only like-for-like conditions, and preferably compare after running your own material through both.
Why does accuracy drop at higher feed rates?
Because particles begin to overlap and present less consistently. The camera sees merged surfaces rather than individual units, so defects hide and acceptable product is misjudged. This is inherent — it is why sizing below rated maximum improves real-world performance.
Is higher resolution always better?
Beyond a sensible threshold, no. Resolution helps detect small defects, but if illumination is poor or presentation unstable, extra resolution delivers little. Many machines are marketed on resolution precisely because it is the easiest number to raise — evaluate the whole optical chain.
How often does accuracy need re-verifying?
Monthly is reasonable for most operations; more often on dusty or oily materials. Post-cleaning verification is valuable, since it confirms the cleaning actually restored baseline performance.
Does AI-based sorting give higher accuracy?
On low-contrast or high natural-variation materials, yes, generally meaningfully better at equal yield. On simple high-contrast applications the gap narrows. The benefit is material-dependent, which is why we always recommend testing rather than assuming.
What is a realistic carry-over target?
Entirely product and price dependent, which is why you must establish your own baseline. Measure current carry-over first, then set an improvement target. Typical well-run lines achieve single-digit carry-over, with best-performing installations below one percent on favourable materials.
The practical takeaway
Stop optimising for the accuracy percentage on a datasheet. Start measuring escaped defects and false rejects on your own line, monthly, at production feed rate. Those two numbers tell you everything that matters, including whether your machine needs servicing, whether your settings suit your current crop, and what each configuration change actually costs you.
The complete economic framing is in our ROI and capacity planning guide, and machine-specific behaviour by product is covered throughout the product range. To settle the question empirically, send us a sample and we will run it and return both measurements from your own material.