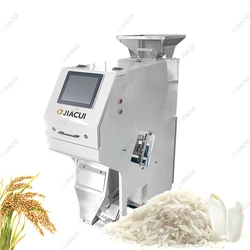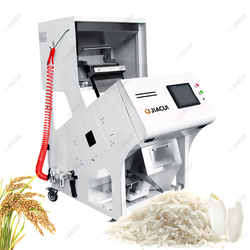



A color sorter is one of the few pieces of processing equipment whose payback can be calculated with genuine precision — provided you measure the right things. The reason is simple: it has no consumables, few wearing parts, and its effect on your output is directly measurable in both recovered product and achieved price grade.
This guide works through the actual arithmetic: how to size capacity correctly, which cost lines matter, how to estimate payback for your own operation, and the specific mistakes that turn good projects into disappointing ones.
Step one: know your numbers
Every credible ROI calculation starts with four figures. Write yours down before talking to any supplier — the conversation will be far more productive.
| Input | Why required | Typical trap |
|---|---|---|
| Annual throughput (tons) | Drives machine class and depreciation per ton | Using peak rather than average |
| Saleable value per ton | Determines value of recovered product | Using average rather than target grade price |
| Price penalty for downgrade | Core driver of sorting value | Ignoring that penalties are often non-linear |
| Current manual sorting labour cost | Direct substitution saving | Often the largest single line |
Two further figures sharpen the estimate considerably:
- Current reject/downgrade rate. What percentage fails specification today?
- Current yield loss. Product currently lost to over-conservative sorting or manual handling.
The whole business case rests on three mechanisms, and separating them prevents unrealistic expectations:
- Labour substitution — replacing manual sorting crews.
- Yield recovery — retaining product currently lost.
- Grade improvement — achieving a higher price band.
Most successful projects receive most of their return from just one of these. Knowing which one applies to *your* operation determines how much you should spend.
Mechanism 1: manual sorting labour
This is usually the simplest line and often the largest. Manual sorting is slow, inconsistent, and increasingly expensive and difficult to staff reliably.
Calculate:
``` Annual labour saving = (operators per shift × shifts × hours × loaded hourly cost) × operating days per year ```
Be honest about loaded cost — wages plus social charges, insurance, supervision, absenteeism cover and recruitment — since that is what actually leaves your account. Also account for what those people do afterwards: redeployment to higher-value work is real value, redundancy less so in human terms but still relevant to cash flow.
The second-order benefit is usually consistency. Manual crews vary by shift, fatigue and individual judgement. A machine applies identical criteria at 3 a.m. and mid-morning, which reduces the costly variability customers complain about.
Mechanism 2: yield recovery
Every percentage point of product wrongly discarded at current selling prices is direct revenue. It is commonly the most under-measured line.
``` Annual recovery value = annual throughput × current loss % × improvement % × value per ton ```
The difficult part is baseline honesty. Establish current loss by weighing actual reject output and comparing against true defect content — you cannot assume it. Many processors discover their loss is several times their estimate, because manual sorting and older equipment discard cautiously.
This is also where machine configuration earns its money. A correctly configured sorter operating with trained models and clean optics routinely recovers acceptable product that threshold-based systems discard.
Mechanism 3: grade improvement
Often the largest single driver, and the least linear. Grade bands frequently step: a lot just inside specialty grade earns dramatically more than one just outside, so moving a single defect count can change lot value substantially.
``` Annual grade value = tons reaching higher grade × price differential ```
Estimate conservatively. Work from your actual buyer contracts, not published commodity prices, since contract structures determine real receipts. Note too that grade improvement is multiplicative with yield recovery: retaining whole kernels also qualifies them for higher grades.
The cost side: what people forget
Purchase price is the visible component. Running cost over ten years frequently exceeds it, so itemise honestly.
| Cost line | Reality check |
|---|---|
| Capital cost | Visible, easy to compare |
| Installation and integration | Frequently underestimated — civil, electrical, air, conveyors |
| Compressed air | Usually the largest ongoing utility cost |
| Electrical power | Modest by comparison |
| Operator time | Cleaning and supervision |
| Spare parts | Ejector valves, lamps/LED modules, filters |
| Downtime risk | Opportunity cost — often the true hidden cost |
Compressed air deserves particular attention. Ejector valves consume substantial air volume, and on high-tonnage lines air cost often exceeds electricity several times over. Inadequate supply also degrades sorting performance, which means false economy in compressor sizing shows up twice. Our energy consumption analysis gives figures by machine class.
Downtime is the worst-run number. A stopped sorter stops the line. Reliability, service response and local parts availability are frequently worth more than a lower purchase price. In our experience this is the line customers most regret not weighting more heavily during procurement.
Capacity planning: sizing is where ROI is won
The most common and most expensive mistake is buying to peak throughput. Consequences compound:
- Running permanently at maximum leaves no margin for feed variation,
- Detection degrades as particles overlap rather than presenting singly,
- Wear and downtime risk increase,
- Yield suffers from both false rejects and poorer discrimination.
Better practice is sizing so routine production sits at 60–75% of rated maximum. This costs more in capital and typically returns it quickly through better yield and fewer stoppages.
Three additional capacity rules:
- Plan reject re-inspection. Recovering acceptable product from the reject stream is standard practice and pays back quickly at most volumes.
- Plan seasonal headroom. New-crop periods and contract peaks are exactly when you cannot afford bottlenecks.
- Plan for multiple products with recipes. Seasonal processors handling several crops need fast changeover more than maximum throughput.
The general sizing methodology with worked examples is in how to choose the right color sorter.
Worked example
Illustrative figures only — substitute your own.
Scenario: mid-size pulse processor, 6,000 tons/year, domestic price US$900/ton, export grade US$1,050/ton.
``` Labour: 4 operators × 2 shifts × 8h × US$6/h × 250 days = US$96,000 /year saved Yield: 6,000t × 2.0% current loss × 60% improved × $900 = US$64,800 /year recovered Grade: 6,000t × 25% reaching export × $150 differential = US$225,000 /year uplift Total benefit ≈ US$385,800 /year Running cost (air, power, parts, operators) ≈ US$38,000 /year Net annual benefit ≈ US$347,800 /year
Capital + installation ≈ US$180,000 Payback ≈ 6–7 months ```
Payback periods of well under two years are typical when grade improvement is a genuine driver. Note how dominant the grade line is here — if your operation has no realistic grade uplift, expect payback to extend substantially and weight labour and yield more heavily in the decision.
Improving ROI after purchase
ROI is not fixed at commissioning. The three highest-leverage post-installation actions:
- Measure carry-over continuously. Weigh reject periodically and check what fraction is actually defective. Rising carry-over signals optical fouling or feed instability before it shows in output quality. Method in our accuracy explainer.
- Maintain discipline on cleaning. Dusty applications degrade detection measurably within a shift. Schedule in the maintenance checklist.
- Use remote diagnostics where available. Faster fault resolution directly reduces downtime, which is the most expensive failure mode. See remote debugging and IoT.
ROI by product type — where value concentrates
| Product | Dominant ROI driver | Notes |
|---|---|---|
| Rice | Grade purity at volume | Visible defects directly determine contract price |
| Cashew | Whole-kernel yield retention | Wholeness drives very large price steps |
| Coffee | Grade achieved, export eligibility | Single primary defect can disqualify a lot |
| Tree nuts | Yield protection | High value per kilogram, prone to breakage |
| Pulses | Labour substitution + upgrade percentage | Thin margins suit high throughput |
| Seeds | Genetic purity and germination value | Seed lots carry large premiums |
If your product appears here with a driver you do not currently measure, start measuring it — that number will tell you more about value than any quotation.
FAQ
What payback period should I expect?
Well-specified installations typically achieve twelve to twenty-four months. Operations with genuine grade improvement often return capital inside a year. Extend your expectation where capacity is oversized relative to actual use, or where you have no grade or labour driver.
Is buying a larger machine than I need a waste?
Usually the opposite. Machines run at 60–75% of rating perform better and last longer. Oversizing specifically for seasonal peaks and future growth is normally sound; oversizing without either is not.
Is used equipment worth considering?
Occasionally, but scrutinise the hidden costs: transport, integration, unavailable parts, absent warranty and service. For a machine whose downtime stops your line, the discount can evaporate quickly. New need not mean most expensive — compare total running cost.
How do I compare quotes that specify different accuracy figures?
Insist on the test condition. Our stated ≥99% is measured at polished japonica rice with approximately 2% foreign content. A figure without conditions is not comparable. Full explanation in what accuracy really means.
What usually goes wrong in these projects?
Four things, repeatedly: sizing to peak instead of average, neglecting compressed air capacity, omitting reject recovery, and insufficient attention to upstream pre-cleaning. All four are avoidable at specification stage.
Should I calculate ROI including financing?
Yes, if borrowing. Interest costs belong in the model, though energy-efficiency investment is sometimes eligible for preferential financing locally. Ask your lender.
Getting a defensible number
The strongest business cases come from measurement, not estimation. Before requesting quotations, capture: annual tonnage, target grade price differential, current manual sorting cost, and current measured loss. Those four figures let you evaluate any proposal objectively.
Review machine classes and their energy profiles in the product range, check typical running costs in the energy efficiency analysis, then speak to our engineering team — bring your material for testing and evaluate streams against your own numbers.